Imagine you’re a digital artist extraordinaire, the Picasso of content creation, deftly splattering vibrant information across the canvas of the internet. You’ve honed your skills to craft visually stunning infographics, transforming data into works of art that captivate the online world. But here’s the twist in our tale: these infographics aren’t just eye candy; they’re the secret sauce to turbocharging your SEO strategy, AKA infographic link building.

Infographic Link Building is the point where creativity meets backlink wizardry and where the digital landscape becomes your playground for innovation. Infographic link building isn’t your run-of-the-mill SEO strategy. It’s a symphony of visuals and hyperlinks, a fusion of aesthetics and analytics, and a wild and wacky adventure through the world of digital marketing. If you’ve ever wondered how to turn your website into the coolest party on the digital block, you’re in for a treat.
So, fasten your seatbelt, put on your creative cap, and let’s dive headfirst into the exciting, vibrant universe of ‘Infographic Link Building.’
Get ready to not only stand out but also link up with the best in the business. It’s time to turn your web presence into a masterpiece that’ll leave both search engines and users awe-struck.
What Is SEO Infographic?
An SEO infographic is a visual representation of information related to Search Engine Optimization (SEO). SEO is the practice of optimizing websites and online content to improve their visibility and ranking on search engine results pages (SERPs). Infographics are a popular way to convey complex information in a visually appealing and easy-to-understand format.
SEO infographics are a valuable resource for both beginners and experienced professionals in the field of SEO. They provide a concise and visually engaging way to understand and remember key SEO concepts and strategies. Many digital marketing agencies, SEO blogs, and educational websites create and share SEO infographics to help people learn and stay updated on the ever-evolving world of SEO.
The Importance Of Infographics for SEO
Infographics are a potent tool for developing one-of-a-kind links, engaging your audience, and extending the reach of a business. Your client can be especially helpful in attracting natural infographic backlinks if they are well-positioned in the SERPs. Due to their capacity to clearly express complicated information, high-quality infographics are also known to encourage social sharing.
When it comes to boosting brand exposure through natural links, social shares, and brand promotion on third party websites, these highly shareable SEO infographics are the most successful sort of rich media.
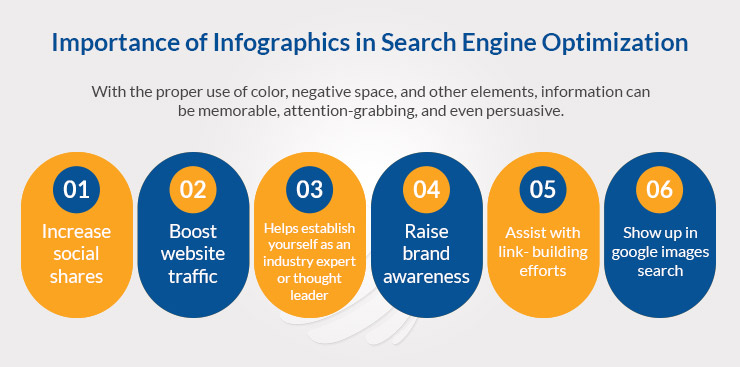
A stronger brand emerges as a result of the increased exposure and engagement, both online and offline. Additionally, it improves the strength of your backlink profile and permits the creation of tiered links when doing infographic link building with QR codes.
Why Is Infographic Link Building an Effective Strategy?
Link building infographics are one of the best tools for increasing the SEO of a website and building high domain authority backlinks for it.
Here are some of the most compelling reasons why you need to work on an infographics SEO strategy:
Infographics are Easy to Share
Since they can be shared on websites and social media platforms such as TikTok, Instagram, Pinterest, Tumblr, Facebook, etc., infographics are simple to post online.

They can be added to emails and even turned into printed materials, just like photographs. Infographics are, therefore, three times more likely to be shared than any other kind of content.
Everyone Loves Visuals
Everyone enjoys seeing things, and images captivate us more than text does. As a result, infographics have a 30 times higher chance of being read by viewers than blog posts and text-based articles.
As a consequence, infographics typically garner more attention and engagement than other types of content. In other words, an infographic campaign would be more successful than other kinds of campaigns.
Easy to Read
Infographics are excellent for another reason: reading them is enjoyable and simple. Comparing reading blog posts to viewing photos and images, viewers spend 10% more time.

Infographics are great for giving your audience quick, digestible bits of information because they won’t have much time to read lengthy content. According to a study, text that is accompanied by graphics and illustrations is understood 323% better.
Types of Infographics
The ability to differentiate between types of infographics is extremely important for infographic link building.
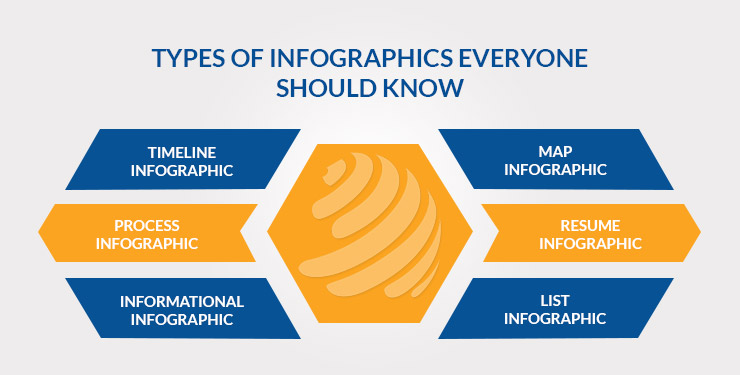
Let’s take a look at a few of the many types of infographics you can create, each tailored to convey specific types of information effectively and engagingly.
Timeline Infographic
Your best bet is a timeline infographic if you want to display historical progression.
Prepare for the occasion, highlight a series of happenings, embark on a trip with your audience, tell a story from beginning to end, set the time frame for a procedure so that the audience is aware of it, or share achievements on various social media channels.
A timeline infographic enables you to visually explain how an idea, product, or story came to be, from telling the history of dessert to providing a summary of crucial data of your professional history.
Process Infographic
One of the greatest infographic formats for infographic link building is a process infographic, especially if you want to dissect a difficult process into manageable chunks of knowledge, give a rundown of the steps in a procedure, and visualize a process.
In other words, if you want your audience to remember the specifics of a process or procedure quickly, you need to use process infographics.
Informational Infographic
The informational infographic format, which is a preferred kind of infographic, is ideal if you want to give an overview of a particular subject, introduce a fresh notion or idea, and increase the reader’s interest in a straightforward blog post or article.
If you’re preparing to convey a highly technical subject to an audience that is unfamiliar with the topic, an informative infographic is a great format.
For instance, somebody unfamiliar with SWOT analysis would be able to understand the concept right away with the help of an information infographic. Informational infographics differ from other sorts of infographics in that they are primarily made up of text or words rather than images.
Map Infographic
If you want to present demographic data or provide place-based information, a map or location infographic is your best bet. These infographics provide simple solutions for drawing attention to trends in a particular area, such as your neighborhood or the entire world, telling visual tales about a certain location, communicating geographically-based statistics for the region and the world, etc.
Resume Infographic
By visualizing their simple CV, job seekers can present themselves in the best possible light by using resume infographics, commonly referred to as the visual resume. If you wish to, you can utilize the graphic resume format in order to.
Make yourself stand out from the competition so the recruiting manager will contact you for an interview, attract hiring managers’ attention, make an impression, and inspire them to learn more about you as well as highlight particular areas and advantages in your CV, such as talents, accomplishments, and teams you’ve worked with.
List Infographic
List infographics are quite common because the human brain loves lists. List infographics are a great option for checklists and to-do lists if you want to share a list of advice, a topic or notion supported by important aspects, or write a summary of your presentation.
How to Create the Best Infographics SEO Strategy
In the dynamic world of digital marketing, where content is king and SEO rules the kingdom, infographics have emerged as the crown jewels of engagement and link-building. Crafting the perfect SEO strategy can often feel like navigating uncharted waters, but fear not, for infographics are your compass to success.
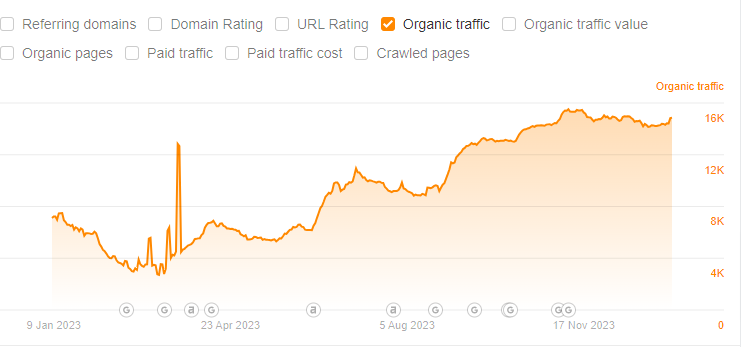
If you’re ready to harness the visual power of infographics to boost your website’s visibility, draw in organic traffic, and conquer the SERPs, join us as we dive into some of the best infographic link building strategies.
Reference Statistics
Utilizing data is the first step in infographic link building. Although many professionals would advise you to create your own link building infographics, this is not strictly necessary.
There are numerous reliable websites where you may find statistical data that is supported by valid research, such as Statista.
If you conduct your own statistics, it will cost you a lot of money and time to obtain these figures. You will then need to calculate these numbers on your own. When the information is there for free, why would you do it on your own?
Makes sense, right?
Utilize the statistics from other websites, but make sure to cite them. You are merely presenting the data in a new way – an infographic.
Use a short sentence to explain where you acquired your data and a link to the source at the bottom or top of your infographic. This should increase credibility and make your infographic trustworthy, shareable, and linkable.
Message Bloggers and Other Influential People
Reaching out to bloggers and influencers in your business or who are relevant to your issue and are known for infographic outreach is another good strategy for infographic link building.
Such outreach must be strategically planned. You shouldn’t start your initial discussion by requesting something. Instead of creating something boring, such as, ‘I made this infographic, would you mind sharing it with your audience?’ think about something creative, such as:
“I created this infographic on [fill in topic], and I believe your audience will really enjoy it. Would you be willing to have a look?
If you receive a response, this is the time to request a share. Simply ask ‘if your audience would be interested in it’ in response. ‘I would love it if you would consider sharing on your website or social media!’ Besides, you may aid your outreach efforts by using a platform like Respona.
Send It to Infographic Directories
You can submit your infographic for publication to several different infographic directories and forums online. Many people will accept your infographic on its own, but some will want a special description to go with it.
This is a fantastic infographic link building method to link back to your original content and promote your infographic to a larger audience.
Submit a Press Release
Making and publishing a press release to various PR sites is another excellent technique to create excitement and interest in your infographic.
Press releases are read by journalists. Therefore, this can provide you with a chance to be highlighted in a significant web publication. Visit some of the well-known press release websites, including PR Newswire, PR Leap, and PRWeb.
Promote on Social Media
Infographics are most frequently viewed on social media, where users are looking for quick, snappy, and satisfying content. Because the audience on these sites prefers quick facts over lengthy content, social media isn’t exactly the best venue for publishing lengthy posts.
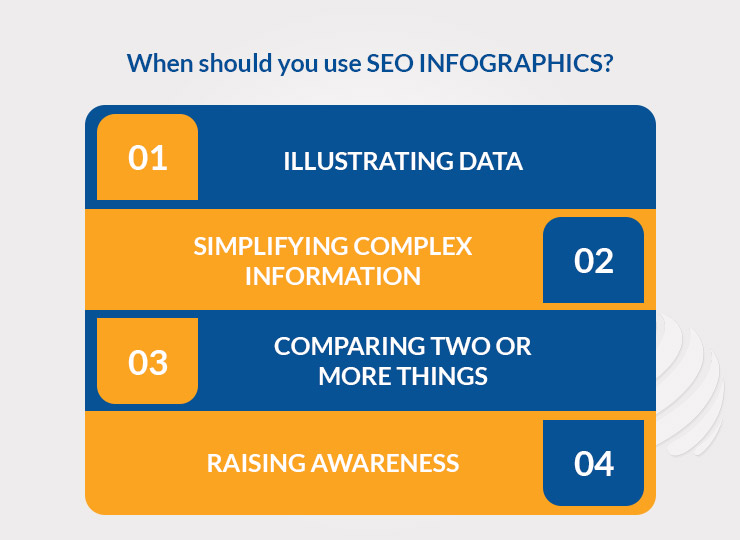
Infographics for SEO are most effective in the following contexts:
One of the finest sites to publish an infographic is Pinterest; the success of an infographic on this platform mainly depends on photos and visuals. Use the proper image ratio to prevent truncation of your pins in the search results page.
Utilize infographics to create backlinks on Facebook by sharing them in social groups. Look for Facebook groups and pages that permit posting without the administrator’s permission.
Make certain to publish infographics with links to your website. Instagram is another image-centric social networking platform where the impact of your photos drives clicks. You can use it for infographic promotion.
Twitter is a fantastic platform to share your infographic because there are character restrictions. Use the available characters to link to your blog and to ask readers to visit it.
On social media platforms like Snapchat and YouTube, avoid using infographics. People desire lengthy, in-depth courses on YouTube, and they are willing to watch what you have to offer. When users open your message inbox or after 24 hours have passed, Snapchat stories disappear.
Strive for Natural, Organic Linking
The ability of infographic link building to continually produce new backlinks is one of its main benefits. When done well, infographics are a terrific way to visually convey the content, which tempts website owners to use the images without conducting manual outreach.
They can be a helpful infographic campaign that can save time because they can be highly linkable and appealing when incorporated into other content. The least time-consuming strategy is natural linking, but it’s also the most difficult to gain links, particularly if your content doesn’t rank highly organically.
If you do well in the SERPs, you might be able to naturally build a lot of infographic backlinks. This is especially valid if the subject is complicated or technical. In order to maximize the return on your investment, we advise conducting keyword research prior to creating your infographic. You need a topic that is heavily searched for while remaining moderately uncompetitive if you want to increase your chances of natural connecting.
Once the infographic is complete, write blog posts about it that provide context and information. This can then be optimized for good visibility in the SERPs as well as infographic link building.
Make Your Infographic Relevant
The infographic’s artwork must be pertinent to the text. If at all possible, your infographic should just have one photo, with each component representing a fact that is discussed in the bullet points.
Even though infographics have changed over the years, the first version, which consisted of just one image and the rest being statistics, is still the best.
You might exhibit a picture of a whale, for instance. The whale’s body then has little icons for its eyes, gut, and other organs. Each icon would then stand for a stat that is described in words. For instance, the tummy might stand in for the amount of oil that a whale can produce, which is why they are targeted. After that, you can mention that bones are used to make perfumes while pointing to them.
Do Manual Outreach
Manual infographic outreach is your next choice if you don’t have solid SERP ranks or aren’t seeing natural linking. Look for websites that share information comparable to your infographic to locate outreach opportunities.
Reaching out to websites that cover subjects similar to your content but not so closely linked that there is perceived rivalry from the websites you are contacting can be helpful.
For instance, if you have an infographic explaining the mortgage application procedure, get in touch with title companies and real estate agents. Because it doesn’t directly connect to what they do but still benefits their audience, these associated businesses may be more willing to link to you.
Contact website owners with a proposal on how to use your infographic and where you believe it would suit the site. Making it simpler for people to add reduces friction.
Finding outreach-driven placements includes looking up a list of websites to contact and coming up with a solution that benefits both sides. This will probably improve the likelihood that your request will be approved.
Finding articles with the same theme as your infographic and contacting the authors of those pieces are good places to start. A link, a piece of content from your website, a review, or even the provision of free content to accompany the infographic could be the benefit exchange.
Pinpoint Your Target Audience
The audience that would be interested in viewing your infographic needs to be thoroughly understood. If you’re making a link-building infographic for your target market, you should pick a very niche subset of people who are most likely to share your material.
The target audience for your infographic link building may be a less focused subset of your audience if you’re capitalizing on a popular topic.
Knowing just who your information is intended for will help you choose the tone and overall topic of your content. For instance, you probably don’t want to use an overly serious tone of voice when speaking to young college students. Your target audience’s preferences in terms of design should be taken into account while creating the infographic’s images.
How to Design Infographics to Get Quality Backlinks?
To ensure that your infographic attracts attention, clearly conveys your content, and ultimately generates high-quality infographic backlinks, it must be carefully designed. We will examine the crucial procedures for producing an effective infographic for infographic link building.
Let’s start now!
Selecting the Appropriate Design Software or Online Tools
Choosing the right design software or internet resources for creating an infographic can have a significant impact on how it turns out.
Here are some important things to think about:
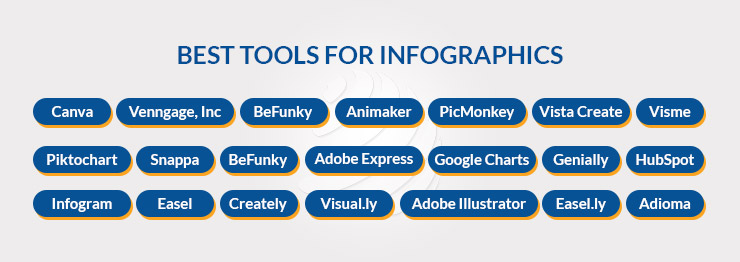
- To select a design software solution that fits your skill level and price range, conduct some research and comparison shopping on programs like Adobe Illustrator, Canva, Piktochart, etc.
- To make the design process simpler, look for user-friendly platforms that include a variety of templates, icons, and configurable features.
- For easy integration into your website, take into account the capabilities that are accessible, such as drag-and-drop capability, built-in design assets, and multiple export possibilities.
Choosing Color and Font Combinations That Are Consistent With Your Brand
In order to effectively represent your business identity within the infographic, color schemes, and fonts are crucial. What you should remember is this:
- Consider your brand’s entire look when selecting colors, keeping in mind your target market and brand personality.
- Use your company’s primary color scheme consistently throughout the infographic to maintain coherence.
- To add visual appeal to the design without overpowering it, maintain a balance between color variations.
- Choose fonts that fit the tone of your brand and are simple to read. To make the design consistent and professional, try to stay away from utilizing too many different typefaces.
Adding Visuals, Charts, And Illustrations To Enhance Visual Appeal
In order to draw in and hold the attention of your audience, visual aspects are crucial.
Here are some crucial things to remember:
- Include pertinent images, graphs, and illustrations that strengthen and support the information in your infographic.
- Make sure the graphics are of the highest caliber as well as relevant to your message. Your infographic will be more aesthetically appealing as a result, increasing the likelihood that it will be shared and linked to.
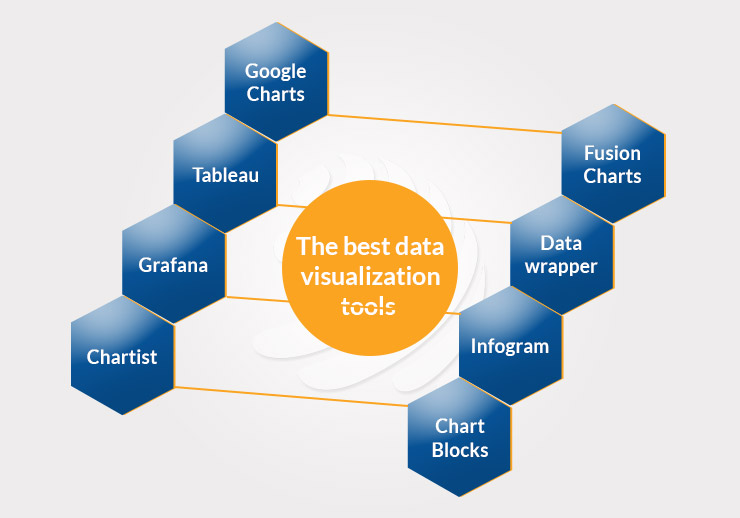
- To portray data in a simple and accessible way that makes challenging topics more palatable, use charts and graphs.
- To maintain an aesthetically pleasant layout and enhance the user experience overall, strike a balance between text and images.
You may make an infographic that effectively communicates your content while also attracting backlinks by following these steps and carefully considering your design choices.
Conclusion
There are many strategies for infographic link building to get links pointing to your website, but one that your rivals may not be considering is infographics as a linking tool.
Think about including these brand links in your clients’ campaigns to increase the number of links as well as to give their audience engaging material that can be used across marketing channels. Promoting infographics is a powerful and effective way to create links to key web pages and/or brand assets.
Make sure to select the appropriate infographic style for your data and include QR codes for linking. You may utilize a lot of free QR code generators. This is very important for infographic link building.
Globex Outreach’s infographic & link building services are a cost-effective combination for infographic link building if you are looking for someone to make a custom infographic and build the links.
Let’s talk!